CPHQ Exam Pass Rate: 2006–2019 Data (October 2020 Update)
From 2016 through 2018, the overall annualized pass rate of the CPHQ exam ranged between 62% and 67%. Over the same period, the CPHQ exam pass rate among US-based CPHQ candidates was 71-73%.
October 15, 2020 Update
Since November 2010, I’ve written three separate posts on the Certified Professional in Healthcare Quality (CPHQ) exam pass rate. For this (October 15, 2020) update, I consolidated all three articles to improve reader experience as well as to make content management easier for me.
If you aren’t inclined to dwell into the ins and outs of the CPHQ exam pass rates over the years (we have data spanning the past 14 years), you merely have to look at the first bar graph below, which summarizes data from 2006 through 2018. The overall pass rate, i.e. that which includes all candidates – both US and international – for 2019 aren’t available at the time of writing this update.
However, the NAHQ has published the 2019 pass rate for US-based candidates – see the second bar chart below.
Common Questions Regarding the CPHQ Exam Pass Rate
“What are the chances of me passing the CPHQ exam?”
“How many people pass the CPHQ exam?”
“What is the CPHQ exam pass and fail rate?”
Many individuals who have considered taking the Certified Professional in Healthcare Quality (CPHQ) exam have asked me these questions (and more).
In this post, I’ll address the question about the proportion/percentage of CPHQ examinees who pass and, by doing so, I hope to correct some misguided information that is circulating around the Internet. (I’m dismayed the garbage floating around in the cybersphere has not only persisted, but has grown over the years!)
CPHQ Exam Pass Rate 2006–2019
The following graph shows the annualized CPHQ exam pass rates for all candidates (US and international) from 2006 through 2018. As at October 15, 2020, the NAHQ has only published the 2019 pass rate for US candidates but not that for international candidates or the overall rate. (Because the NAHQ reports the pass rate for the calendar year, the 2020 data will only be available in 2021.)
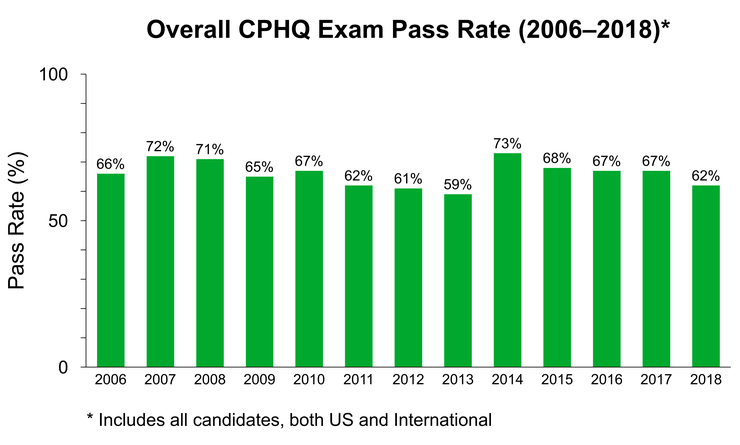
The figures from 2012–2018 were pulled directly from the 2020 edition of the CPHQ Candidate Examination Handbook. The figures before 2012 were drawn from my records, which in turn were sourced in various ways – you can take my word that the numbers I’ve reported in the graph above are accurate or you can read on for the details.
The annualized CPHQ exam pass rate among US-based candidates from 2012 through 2019 ranged between 71% and 82%.
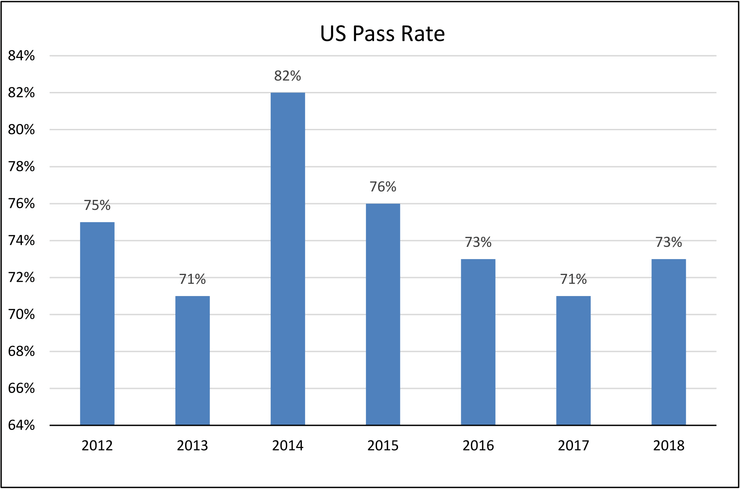
The pass rate for US-based candidates in 2019 – 71% – was found in an addendum to the NAHQ’s 2019 Annual Report. The pass rates for all candidates or for international candidates were not included.
Notice the discrepancy between the 2018 figures? To be clear, the 2018 figure in the CPHQ Candidates Examination Handbook 2020 was 73% but the figure in the addendum to the NAHQ Annual Report 2019 was 71%. Both came from the same source – NAHQ!
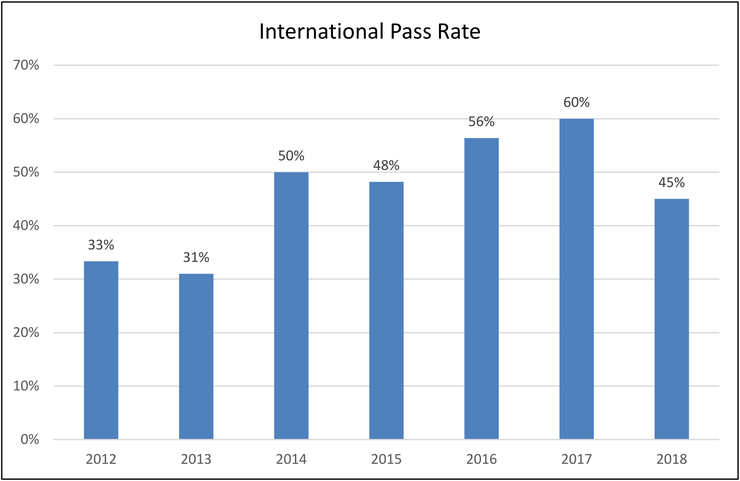
The “international” pass rate is significantly lower than the US one, ranging between 31% and 60% from 2012 through 2018. Over this period, there has been an uptrend in the pass rate among international CPHQ candidates.
Why People Want to Know the CPHQ Exam Pass Rate
I suppose the main reason why people are so interested in these numbers is that they want to gauge their chance of success in the exam.
However, using the statistics above to predict your probability of passing the CPHQ exam makes one or more of the following assumptions:
- Passing the CPHQ exam is a game of random chance, akin to winning a lottery (which it is not).
- The composition of the examinees/candidates, in terms of knowledge, skills, training, education, and experience, will remain the same in future years as it has been in the past (which it will not).
- Your overall knowledge and skills in the subject matter tested in this exam is equivalent to the historical mean of examinees in preceding years (which may or may not be the case).
- The passing score for the CPHQ exam in the future reflects a level of difficulty that is identical to that of the exam in the past (which may or may not be the case).
A Rational Approach
I’m aware that some people get hung up over numbers such as those above. This is probably unnecessary. Why? Because these figures lack any predictive value for your own set of circumstances.
For you: the exam result is a dichotomous variable, i.e. Pass/Fail.
As most or all of the assumptions I’ve listed above cannot be true, the pass rate, which is a proportion/percentage, does not add practical value.
Many different factors contribute to success (or failure) in this exam: education, professional training, experience in healthcare quality management, the amount and quality of preparation for the exam, exam technique, familiarity with the concepts tested, etc. Like most other aspects of life, there are some things you can change quite easily and quickly, and others you can’t. Examples of the latter are: age, background, profession (nursing, medicine, health informatics, pharmacy, etc.), educational level (diploma in nursing, bachelor’s degree, master’s degree, doctoral degree), country of practice, healthcare quality experience.
On the other hand, there are some things that you can do to positively affect the outcome of the exam. These include:
- Reading relevant material.
- Participating at CPHQ exam preparatory workshops and courses.
- Attending conferences and seminars related to healthcare quality.
- Receiving CPHQ exam coaching.
- Attempting CPHQ exam practice questions and closing any knowledge gaps identified.
- Discussing quality issues and CPHQ exam practice questions with colleagues.
etc.
Doing all these things doesn’t guarantee a passing score and the utility of each depends on the individual’s baseline knowledge, experience, preferred learning style, etc. But collectively, these activities would certainly help individuals get closer to passing the exam.
Bottom Line Regarding the Published Pass Rates
Based on the statistics and my own personal observations, I would rate the CPHQ exam as moderately difficult for most people who sit the exam.
Overall, about two thirds (2/3) of examinees pass.
However, examinees vary considerably in knowledge, skills, and experience. Historical pass rates should neither encourage nor deter anyone considering the CPHQ exam. Instead, it might be more beneficial to evaluate the professional, financial, and personal implications of preparing for and passing the CPHQ exam.
CPHQ Exam Pass Rate 2006–2009
Working in chronological order, this section condenses the information in my earliest post, dated November 29, 2010, on the CPHQ exam pass rate, i.e. that from 2006–2009.
At this stage, you might be wondering why I went through all the trouble of crunching data instead of taking a screenshot of the pass rates published by the NAHQ/HQCB/HQCC. Well, in late 2010 when I wrote the post, there were no time-series data on the annualized pass rate! In fact, it would be two or three years later that the NAHQ/HQCB/HQCC started publishing these data in the CPHQ candidate examination handbook. Up till around 2013, the NAHQ only published the CPHQ exam pass rates for any single calendar year in their annual reports.
From January 2006 through December 2009, a total of 2694 individuals took the CPHQ exam. Of these, 1845, or 68.5%, passed. I chose the period 2006–2009 because complete data were readily available and CPHQ candidates could only take the exam in its computerized version at Applied Measurement Professionals, Inc (AMP) centers from 2006 onward.
In the years just prior to this period, the exam was available in two versions: a computer-based domestic (US) exam and a paper and pencil international format. With the information on hand, comparison of the pass rates before and after 1 January 2006 might not be valid. The graph below shows the annual percentage of candidates who passed the CPHQ exam from 2006–2009.
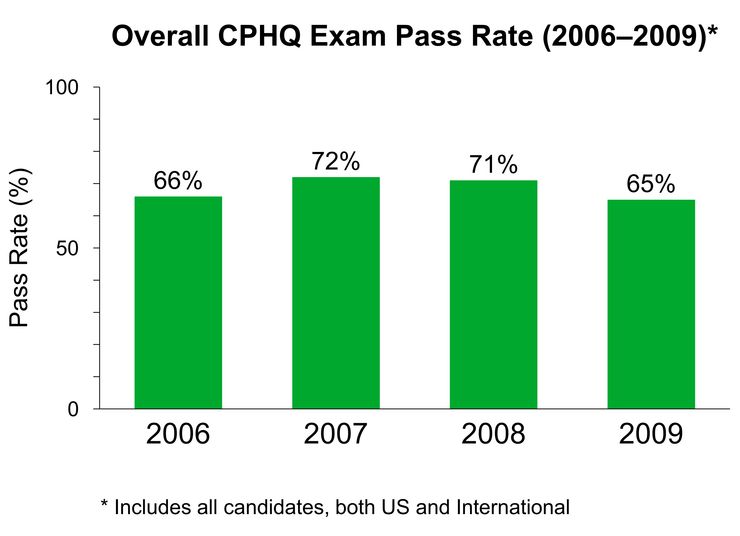
The following table gives the number of persons who attempted the exam and the number who passed for each of the last four years, i.e. 2006–2009.
| Year | Persons Who Sat the Exam | Persons Who Passed the Exam | Pass Rate (%) |
|---|---|---|---|
| 2006 | 529 | 348 | 65.8 |
| 2007 | 767 | 553 | 72.1 |
| 2008 | 607 | 428 | 70.5 |
| 2009 | 791 | 516 | 65.2 |
| TOTAL | 2694 | 1845 | 68.5 |
These figures are for illustrative purposes only. They do not tell us, for example, what proportion of first-time examinees passed. Neither do we know their educational level, years of experience in quality management, place of employment, etc.
What Do These Numbers Mean?
In summary, between 2006 and 2009, fewer than 69 out of every 100 examinees passed. This statistic includes both first-time and repeat examinees.
CPHQ Exam Pass Rate in 2010
I published another post on May 25, 2011 to share my thoughts on the data the NAHQ published on the pass rate for the preceding year, i.e. 2010, in its 2010 annual report. The following is a condensed version of what I wrote about the 2010 CPHQ exam pass rate.
Most of the NAHQ’s 2010 printed annual report was unremarkable but a stacked bar caught my attention – aggregate pass rates for the CPHQ exam in 2010.
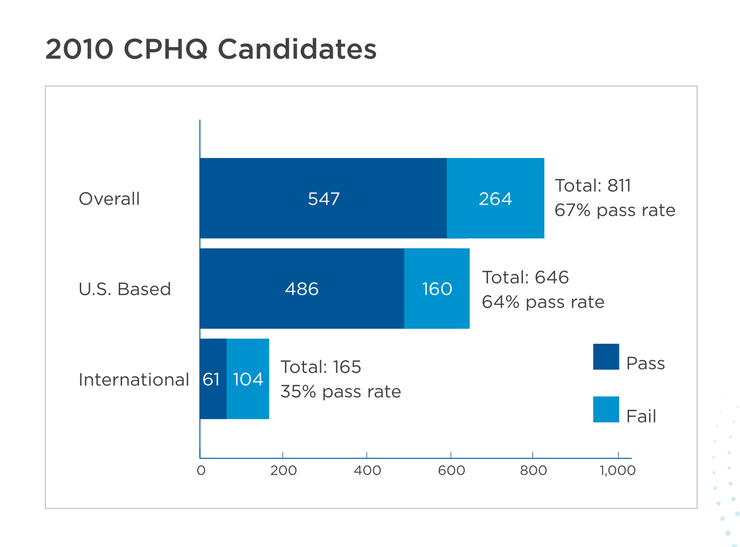
Although this was not the first time the Healthcare Quality Certification Board (HQCB) (recently renamed the “Healthcare Quality Certification Commission” (HQCC)) had published CPHQ exam pass rates, we hadn’t seen a breakdown between domestic (US-based) and international (non-US-based) candidates presented in this manner for some time (years!).
The chart was particularly interesting to me, but for reasons you probably did not expect.
The numbers just did not add up.
Call it whatever you want – my training in statistics, my work as a healthcare quality consultant and having to deal with a lot of graphs, or my attention to detail – the chart looked wrong.
I did some mental math and it was still wrong. So I took out an electronic calculator and got the following numbers: Overall 547 ÷ (547 + 264) = 67.4% (When rounded off to a whole number, this was consistent with what was published. This is also consistent with the CPHQ exam pass rates of recent years – see above.)
U.S. Based: 486 ÷ (486 + 160) = 75.2% (NAHQ-published rate: 64%)
International: 61 ÷ (61 + 104) = 37.0% (NAHQ-published rate: 35%)
Notice the discrepancy in the figures? Typo errors on the part of the HQCB/HQCC? That was my thought initially. But there is another (simple) explanation.
We know there is always going to be a failure rate among candidates, and a large proportion of those who don’t pass on their first attempt will try again. Some candidates even take the exam three times within the same calendar year. Though possible, I would be extremely surprised if someone attempted the CPHQ exam four times in a single calendar year because candidates were permitted to take the exam only once per 90-day period.
The numerator (number of candidates who passed) will remain the same, regardless of the denominator used, because CPHQs who have passed won’t take the exam again in the same year – that would be nuts! (And not permitted by the rules).
If the denominator was the number of attempts by all candidates in 2010 (as opposed to the total number of candidates), then the quoted pass rate for US-based candidates and international candidates (but not the overall figure) in the bar chart above could actually be valid. In fact, I believe this was probably the case. (This actually gives us some insight into the degree of “dilution” that occurs if we take into account total number of attempts by candidates.)
However, the lack of internal consistency in the chart above, especially in the context it was presented, is disturbing.
If the denominators used for US-based candidates and international candidates were indeed the number of attempts, then we should have seen a dilution of the published overall pass rate as well, i.e. a figure lower than 67%, in addition to lower (diluted) figures for both US-based and international candidates (which is the case).
Following this analysis (which took me less than three minutes), I drew several general conclusions:
- Most candidates (79.7%) were based in the US.
- International candidates, though a small proportion of the candidate pool in 2010, was the faster growing segment. In other words, compared to previous years, relatively more persons outside the US attempted the CPHQ exam in 2010. Unfortunately, they had problems passing – this might or might not truly reflect their ability in the field of healthcare quality. As a whole, the skills and knowledge of international candidates in healthcare quality management were not – and still are not – at par with their US counterparts (I know this fact because I work with a diverse range of candidates from the US and outside the US). Several other factors contributed to the low pass rate, including cultural issues, language, training, and local experience. As I sometimes point out to my students (both US-based and international), the CPHQ exam was, and still is, US-centric and not as “international” as suggested by the HQCB/HQCC in the past.
- The overall pass rate in 2010 was similar to, or worse than, rates in recent years. With the introduction of various educational programs and other resources to prepare candidates in the previous few years, we should have expected a gradual improvement in the overall pass rate. Clearly, the latter did not happen and the utility of traditional methods of exam preparation (as well as new ones) ought to have been (re)considered.
- The pass rates among our students (both in the US and elsewhere) were significantly higher than the corresponding average in each segment (US-based; international). This is hardly surprising, at least to us. Our students will attest that we do many things differently around here. For us, what matters the most is the result. If, on the whole, candidates prepared for the exam in the same way as their predecessors, their overall results would remain the same, i.e. about 67%. A change in their approach to the exam would not guarantee a better result but would give them a better chance of doing so. If the definition of insanity is “doing the same thing year after year and expecting different results,” then a large proportion of CPHQ candidates need to see a shrink.
- International candidates did not reattempt the exam after failing the first time as frequently as their US-based counterparts. This contributed to the wide gap in pass rates between the two groups but it’s not the sole reason. Depending on their individual set of circumstances, not reattempting the exam might have been the prudent choice for international candidates. On the other hand, as shown by the numbers (and provided my hypothesis that the number of attempts is used as the denominator is true), multiple attempts – at least among US-based candidates – were associated with an improvement in the overall pass rate. This should not be misinterpreted as proof multiple attempts improve an individual’s chances of passing the exam – this is also dependent on multiple factors on an individual level.
- There were only 547 new CPHQs in the whole of 2010(!), which probably makes the credential a highly sought-after commodity, and therefore extremely valuable.
Back to the bar chart. The ideal chart/graph/table tells the whole story without the reader having to refer to the text. In this case, the chart does a good job in providing the number of candidates based in the US as well as internationally. However, where it falls short is in the stratified pass rates, which do not tally with their corresponding numbers, and may leave readers perplexed.
National Association for Quality (NAHQ) Annual Report 2012
In a separate post, entitled “CPHQ Exam Pass Rate in 2012 (and What the NAHQ Didn’t Tell You)”, dated July 1, 2013, I gave my commentary on the 2012 data, which I summarize below. Someone at the NAHQ must have finally paid attention to my analyses on the matter because they got their act together by publishing annualized pass rates in the CPHQ candidate examination handbook after 2012. It is also interesting to note the rather unusual time frame of the data presented in the current (2020) exam handbook, i.e. 2012–2018. You would have expected something more conventional, perhaps 10 years of data, not seven years!
In that July 1, 2013 piece, my summary was:
The overall CPHQ exam pass rate among US candidates in 2012 was published in the NAHQ Annual Report 2012, which again suffered from the DRIP (Data Rich, Information Poor) syndrome.
As a healthcare quality consultant, I deal with reports all the time. If there’s one thing I’ve learned, it’s that the devil is in what they don’t tell you. (Much like dealing with unscrupulous salesmen.)
The National Association for Healthcare Quality (NAHQ) 2012 Annual Report [PDF – 2 MB] raised alarm bells in my head… again. A couple of years earlier, I had a similar experience with the NAHQ Annual Report 2010 when I looked at its graph that presented the 2010 CPHQ exam pass rates – see above.
You might have thought a quality organization like the NAHQ would pull up their socks when presenting data. You’d be disappointed if you read its 2012 Annual Report.
First things first. Let’s recap what people could reasonably expect if they spent their precious time reading a report.
- In the case of the NAHQ’s annual report, I imagine most people would be seeking information that they had not known before they opened the document, i.e. fresh information.
- Further, a chart, graph or table should tell the reader the whole story without him (or her) having to refer to accompanying text.
- The information provided in a report, especially an annual report, should address all the essential questions. For example, if a company reports a profit of $1 million, it still has to show its total revenue, sources of the revenue and their amounts, total expenditure, and a breakdown of how the money was expensed (among other things). If there were any one-off items that affected the bottom line, these should be clearly stated (not hidden in marketese or charts). In this example, the company could have made a $1 million profit on a $10 million revenue or a $150 million revenue – these two scenarios have vastly different implications.
- There should also be minimal blah-blah text (that few people read anyway).
The image below is a screenshot of Pages 20 and 21 of the NAHQ Annual Report 2012 – click here for an enlarged copy [PDF – 214KB].
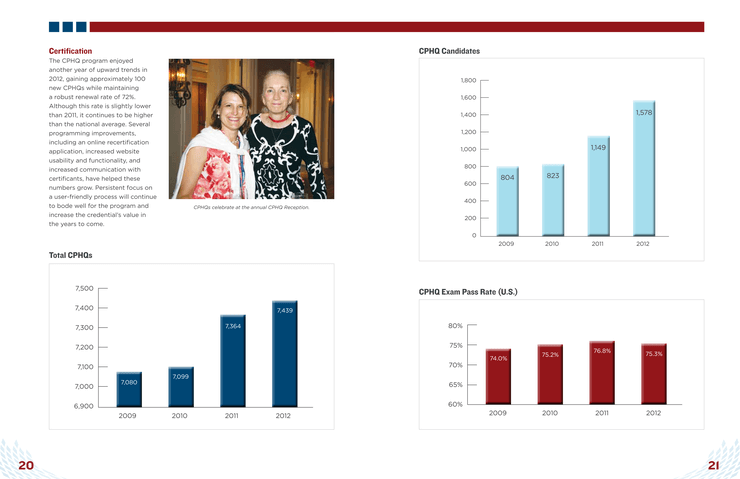
CPHQ Exam Pass Rate in 2012
The three graphs fill one and a half pages – that’s plenty of real estate in a 35-page report, especially when the rest of the report is deficient of real content! Check out the entire report for yourself here [PDF – 2 MB].
Exhibit 1: Total CPHQs (Page 20)
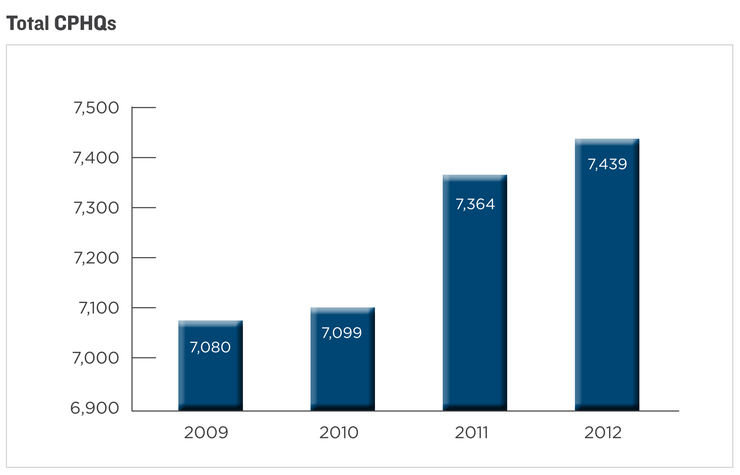
The number of active CPHQs had hardly grown between 2011 and 2012. To be precise, there was an increase of only 75 CPHQs from 2011 to 2012. This is on the back of 984 new CPHQs in 2012. In other words, 909(!) CPHQs did not renew their certification in 2012. Why?
Furthermore, the numbers of CPHQs reported each year on this graph included both US and international CPHQs – more on this issue below. There was a small jump in the number of CPHQs between 2010 and 2011 (265 CPHQs, or 3.7%), which remains poorly explained unexplained.
Note that the scale on the vertical axis starts from 6900, and not zero (at it should). In my commentary of the NAHQ Annual Report 2011, I provided links to two references that explain why this is not acceptable when presenting data:
- Ezra Klein’s “Lies, damn lies, and the ‘Y’ axis”; and
- Page 2 of this document entitled “Misleading Graphs and Statistics.”
In case you missed it, Exhibit 1 (the graph on Total CPHQs on Page 20 of the 2012 annual report) also solves the problem I had with the NAHQ Annual Report 2011. In 2012, I identified shortcomings in the numbers reported in the following graph (Page 17 of the NAHQ Annual Report 2011):
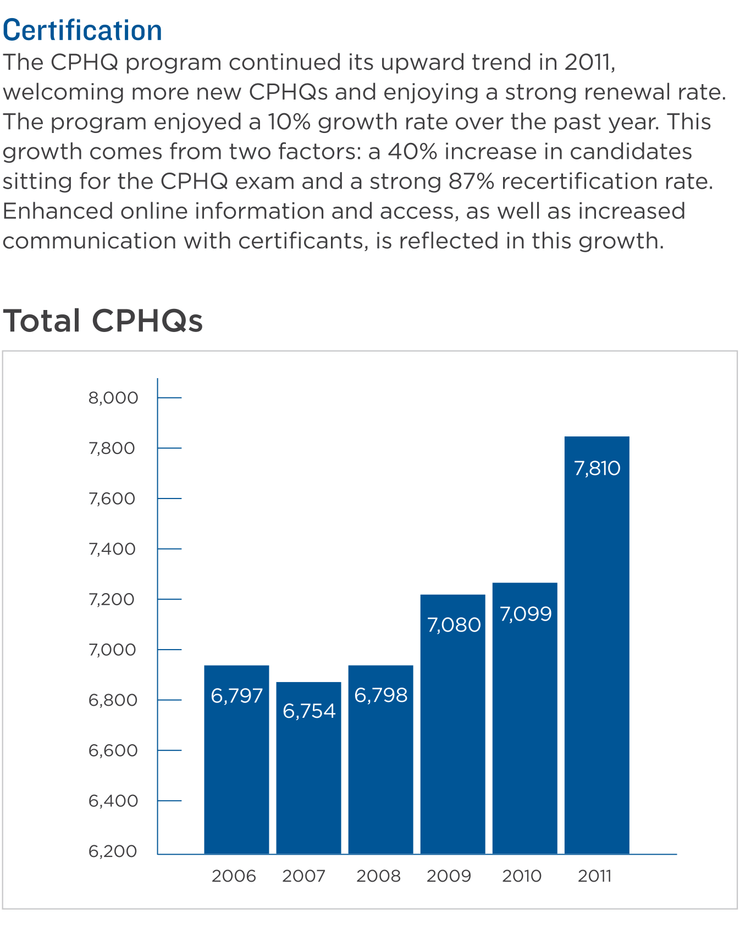
In 2012, I wrote:
Bottom line: the numbers do not add up. Your next question is probably, “Where is the error?” The simple answer is “I don’t know.” But here are some possibilities:
The total number of CPHQs in 2011 is not 7810 as stated in the chart. This seems the most likely since the numbers have been flat for several years. By this, I do not mean to imply there was no growth in CPHQs. In fact, based on the demand for my CPHQ exam preparation services, as well as the strong growth in sales of the Teh & Associates online CPHQ exam preparation products, I would be extremely surprised if there was no increase in CPHQ numbers in 2011. I also note from comparing the 2010 and 2011 annual reports, “expenditure” on certification activities were more than $110,000 in 2010 compared to 2011. Increase in marketing in 2010 may be part of the reason for an increase in CPHQs in 2011.
The explanation for the 10% growth in total CPHQs between 2010 and 2011 is incomplete.
The explanation for the 10% growth in total CPHQs between 2010 and 2011 is inaccurate.
All of the above.
As it turns out, the 2012 annual report (which of course came out only in 2013) vindicates my suspicions about something being amiss.
The number of CPHQs in 2011 (reported in the 2011 Annual Report) was grossly exaggerated! The NAHQ reported 7810 CPHQs in 2011 but corrected this figure to a more realistic 7364 in their 2012 Annual Report. (Like how the NAHQ quietly made that correction? Especially after boasting about the “10% growth rate”?)
Exhibit 2: CPHQ Candidates (Page 21)
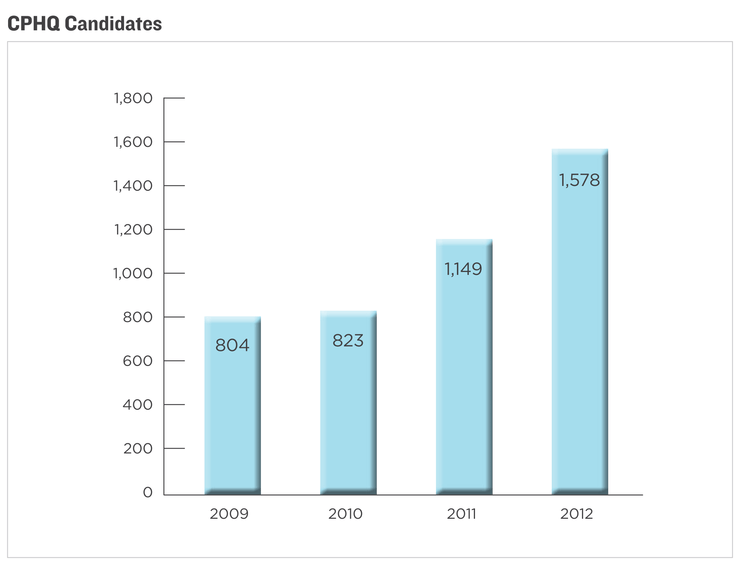
There was a large increase in the number of CPHQ candidates from 2011 to 2012 (429 candidates). This could, at least partially, be explained by the NAHQ/HQCC informing (scaring?) everyone with the new CPHQ exam content outline that came into effect in the second quarter of 2013, and people reacting by rushing to take the exam before the transition date.
Again, the numbers on this graph include both US and international candidates – read below to see why this is a problem.
Questions you might be asking:
“What was the total number of US candidates in 2012?”
“What was the total number of international candidates in 2012?”
The graph doesn’t tell us this information even though it should. Why did the NAHQ omit this information?
Using simple math, I worked out that:
- There were 1074 US CPHQ candidates in 2012, and
- There were 504 international CPHQ candidates in 2012.
I could be out by up to 3 either way, but certainly not by much. My calculations were based on the following data:
- There was a total of 1578 CPHQ candidates in 2012 (Exhibit 2);
- There were 809 US candidates and 175 candidates who passed the CPHQ exam in 2012 (based on the NAHQ’s list of all 2012 new CPHQ certificants); and
- The overall pass rate among US candidates in 2012 was 75.3% (Exhibit 3).
(I welcome you to do the math yourself.)
Now, do you see why the NAHQ chose not to show the breakdown of US and international candidates in this graph? (By the way, in the reports of recent years, a breakdown of US and international candidates was provided in some form or other.)
In the year before the NAHQ/HQCC amended the CPHQ exam content outline to include US-specific competencies (i.e. 2012), approximately one-third of candidates (504/1578) were based outside the US.
CPHQ exam fees (and other related products) represented, and still represents, a large proportion of revenue received by the NAHQ. By amending the CPHQ exam content outline to make it US-specific in 2012 (or claiming to do so… more on that in a separate post), they risked alienating about a third of the candidate pool (by the 2012 numbers). How smart was that decision? It’s downright embarrassing!
Exhibit 3: CPHQ Exam Pass Rate (U.S.) in 2012
Pass Rate Among US Candidates in 2012
Why report only the CPHQ exam pass rate for US candidates? Especially when a third of your candidate pool is international? One possibility is that the NAHQ chose to put forward the best pass rate that it could put down on paper (75% does look pretty good). But if that were the case, it’s deceptive.
Why include international CPHQs and international CPHQ candidates in the first two graphs but not the third?
Maybe including the international guys in the first two graphs makes the numbers look better but including the international candidates in the third graph gives an overall pass rate of only 62.4%.
Let’s be clear: the quoted 75.3% pass rate applies to all 1074 US candidates in 2012. We know that not all persons who take the exam for the first time will pass. Some candidates who don’t make it on their first attempt will retake later, maybe three or four months later. (You’re only allowed one attempt within a 90-day period.)
Therefore, there would have been a proportion of persons who sat the exam twice or even three times in 2012. The figure of 75.3% includes all candidates, irrespective of their number of attempts.
Pass Rate Among International Candidates in 2012
The overall pass rate among international candidates in 2012 was a dismal 34.7%, i.e. 175/504. This figure, again, includes those who sat the exam multiple times. However, international candidates do not retake the exam as frequently as their US counterparts, hence the elevating effect of candidates attempting the exam more than once is less, compared with US candidates. A rough estimate of the pass rate among international candidates taking the exam for the first time is about 30%, and that among those who take the exam more than once is about 45%.
CPHQ Exam Pass Rate Among ALL Candidates in 2012
As stated above, the overall pass rate – both US and international candidates included – in 2012 was 62.4%, based on my calculations.
Note: the figures published by the NAHQ after 2013 on the 2012 pass rates differ a little from those I calculated:
| Candidates | My calculated pass rate (%) | Pass rate published by NAHQ (%) |
|---|---|---|
| International | 34.7 | 33 |
| Overall | 62.4 | 61 |
Pretty darn close if you ask me. We don’t know how the NAHQ derived their numbers, but I certainly know how I got mine. Unless I have reason to believe otherwise, my calculated figures seem more accurate to me, especially given the NAHQ’s less-than-stellar reporting of data at times in the past, some of which I have highlighted in this post.
Takeaways From the NAHQ Annual Report 2012
Information contained in Pages 20 and 21 of the NAHQ’s 2012 Annual Report left much to be desired.
However, there was enough data in there to make some inferences, when used with other information published by the NAHQ, e.g. the list of all new CPHQ certificants in 2012. But we really shouldn’t have had to do all that legwork when the information people wanted to know – and expected in such an annual report – was readily available to the folks who prepared the report. Looking past the pretty images and average marketing copy, the graphs offered a juicy opportunity for the NAHQ to communicate data/information in a succinct and interesting way. Alas, the NAHQ failed on this count.
Conclusions
Looking through the annualized CPHQ exam pass rates from 2006 through 2019, we can draw the following conclusions:
- Among US candidates, the pass rate has remained relatively stable from the low-70s to low-80s, i.e. 71–82%, since 2012.
- Among international candidates, the pass rate has trended higher in the past decade but with greater variation from year to year. The latter is possibly a function of the comparatively fewer number of international candidates – the smaller denominator increases the risk of greater variance. The official pass rate was only 33% in 2012 and was 45% in 2018. One could hypothesize the observed improvement was inevitable given the low baseline.
- Overall, US candidates perform better than their international counterparts.
- The NAHQ’s reporting of the CPHQ exam pass rates in the past decade has been sloppy at times; however, its botches in data presentation offer learning opportunities on what not to do.
- Despite being a topic of great interest, the CPHQ exam pass rate has limited utility in predicting success for examinees.
Subscribe to Our Newsletter
Subscribe to the CPHQ Tutor newsletter to receive ongoing information about CPHQ exam preparation, happenings in the CPHQ program, and our products and services.
I didn’t actually count, but looking at the list, I was struck by the disproportionate number of female names. Are men suffering from discrimination in the healthcare quality field, or is there another explanation for this apparent gender imbalance?
@David – In the US and Canada, the majority of people who pursue the CPHQ credential are nurses. About 94–95% of nurses in North America are women, so it doesn’t surprise me that most CPHQs are female. I know a few male CPHQs in the US, so they do exist. Further, I expect to see more male CPHQs in the future as more men enter the nursing profession. The situation is quite different in Asia, e.g. Saudi Arabia, UAE, Egypt, etc. There is a much higher proportion of physicians among the CPHQ candidates in those countries, and most of them are male. This explains the greater proportion of males among non US-based CPHQs, compared to US-based CPHQs.
Why not let test takers know which questions they have missed so they can study that area?
@Harriet ford – The CPHQ exam score report gives the raw scores for each of the 4 major content categories (Management & Leadership; Information Management; Performance/Quality Measurement & Improvement; Patient Safety), but it doesn’t tell you which questions you missed. This information won’t matter much for candidates who pass the exam, but it will certainly be useful to those who don’t. Of course, when users take our CPHQ exam practice questions, they will know exactly which ones they got correct and incorrect. What’s more, you also have an explanation of our answer and, for selected questions, tips specific to the CPHQ exam.
I would like to do CPHQ exam whats the condition??? And how i can applied .
Thank you
@Fouzia boukhatem – You might like to read our article “Am I Eligible to Take the CPHQ Examination?”. Application for the exam can be done either online or by mail. In either case, you will need to log into the NAHQ website.
I’m very concerned about the % of pass rates for people of color. I have not seen one to date.